
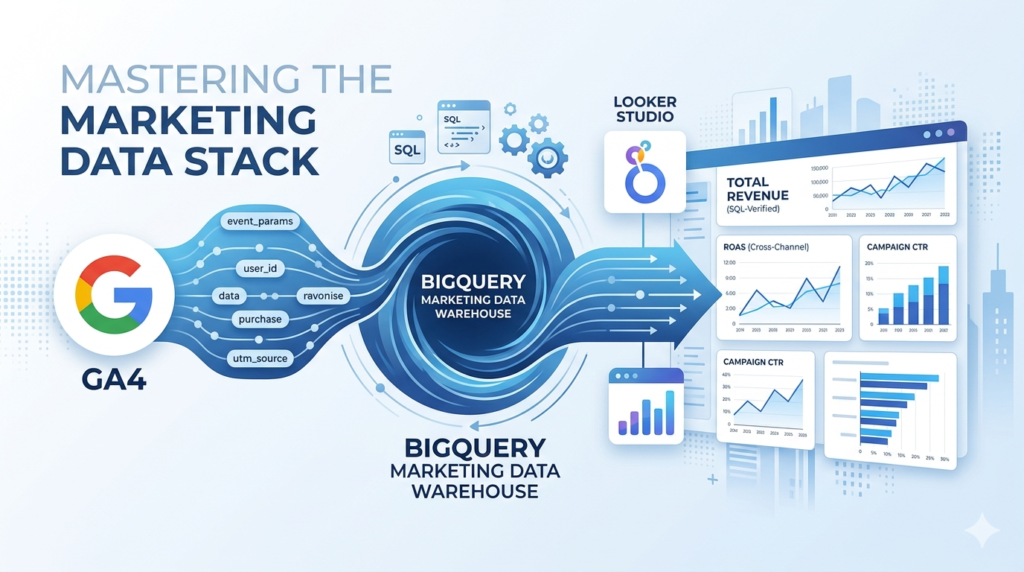
Mastering the Marketing Data Stack: BigQuery, GA4 & Looker Studio
Automate Your Marketing Analytics: The Ultimate 2026 Guide to GA4 BigQuery Export, Looker Studio Dashboards, and Advanced SQL for Marketers. Stop Manual Reporting, Bypass Data Sampling, and Build a Low-Cost, Automated Pipeline for Cross-Channel ROAS and Customer Insights in the Google Data Stack.
Struggling with GA4 data limits and tedious manual reporting? It’s time to build a professional marketing data pipeline. This expert guide shows you how to bypass sampling, own your raw data in BigQuery, and automate stunning Looker Studio dashboards using SQL.
Introduction: The “Spreadsheet on Steroids” Hook
If you are still exporting CSVs from Google Analytics 4 and spending your Mondays stitching them together in Google Sheets, you aren’t doing “analytics” you’re doing manual labour.
Think of BigQuery as your marketing warehouse on steroids. While a spreadsheet begins to lag at 50,000 rows, BigQuery can process billions of rows in seconds. This isn’t just about speed; it’s about Data Ownership. In the native GA4 interface, your data is sampled, summarized, and eventually deleted. In the BigQuery Marketing Data Stack, every single click, scroll, and purchase is stored in its raw, unfiltered glory.
The Foundation: Why BigQuery is the “Brain”
In the Google Marketing Platform (GMP) ecosystem, tools like GA4 and Google Ads are the “Sensors” they collect the signal. Looker Studio is the “Face” it displays the results. But BigQuery is the Brain.
- No Data Sampling: Get 100% accurate numbers, not “estimates.”
- Historical Retention: GA4 deletes data after 14 months by default. BigQuery keeps it forever.
- Cross-Channel Logic: Calculate true ROAS by merging Facebook Ads, Google Ads, and Shopify data.
- Resource: Review the Official Google Cloud BigQuery Overview to understand the infrastructure.
The Technical Bridge: GA4 to BigQuery & “Unnesting”
Linking GA4 to BigQuery is a “set it and forget it” process. However, once the data arrives, it follows a Nested and Repeated structure.
To read this, you must use the UNNEST function. Think of it like opening a suitcase: you can’t see the clothes (parameters) until you unzip the bag.
- Step-by-Step Guide: How to set up the GA4 BigQuery Export.
- Technical Reference: GA4 BigQuery Export Schema.
Actionable SQL: “Quick Win” Snippets
You don’t need to be a computer scientist. Use these “Golden Queries” to prove immediate value. Use the BigQuery SQL Syntax Reference if you get stuck.
1. Calculating ROAS (Return on Ad Spend)
SQL
SELECT
  utm_source,
  SUM(purchase_revenue) AS total_revenue,
  SUM(ad_spend) AS total_cost,
  SAFE_DIVIDE(SUM(purchase_revenue), SUM(ad_spend)) AS roas
FROM `your-project.your_dataset.marketing_table`
GROUP BY 1
The Visualization: Looker Studio Best Practices
When connecting your BigQuery “Brain” to your Looker Studio “Face,” follow these design tiers:
- Executive Dashboard: Focus on ROAS and Total Revenue. Use the Looker Studio Gallery for inspiration.
- Operational Dashboard: Granular CTR and Conversion Rates.
- Pro-Tip: Use BigQuery Views to pre-process data so your dashboards load instantly.
Manual vs. Automated: The Reality Check
| Feature | Manual Reporting (Sheets) | Automated Stack (BQ + Looker) |
| Accuracy | Prone to human/sampling error | 100% Raw Data Integrity |
| Time Spent | 4-8 hours per week | 0 hours (Automated) |
| Retention | Limited to GA4 UI settings | Permanent / Infinite |
Pro-Tips: Staying Under the $10/Month Limit
- Stop using
SELECT *: Only query the columns you need. - Partition Your Tables: Use the
_TABLE_SUFFIXto filter by date. - Monitor Costs: Set up Cloud Billing Budgets to avoid surprises.
Move from Data Collection to Data Ownership
The era of “Export to Sheets” is over. By mastering the Marketing Data Stack, you aren’t just making prettier charts; you are building a proprietary asset for your business.
Please look into this detailed tutorial guideline slides to master the BigQuery, Looker Studio, and GMP.
📚 Table of Contents
🟢 Section 1: Foundations
1. Title & Learning Outcomes 2. What is BigQuery? 3. Why BigQuery for Marketers? 4. GMP Ecosystem Map 5. Looker Studio Explained 6. Setting Up GCP Project 7. Enabling API & Billing 8. Projects, Datasets, Tables 9. BigQuery Pricing 101 10. Security & IAM Basics 11. Your First Query 12. Quick Win: GA4 Sample🔵 Section 2: Connecting Data
13. Data Sources Overview 14. Linking GA4 to BigQuery 15. GA4 Schema Explained 16. Flattening Nested Data 17. Querying Multiple Tables 18. Google Ads Data Transfer 19. Importing CSV/Sheets 20. No-Code Pipelines 21. Blending vs Pre-Joining 22. Creating Views 23. Time Zones & Timestamps 24. Data Quality Checks 25. Unified Marketing Table 26. E-commerce Case Study 27. Troubleshooting Errors 28. Knowledge Check🟡 Section 3: SQL for Marketers
29. SQL Basics Refresher 30. Filtering GA4 Events 31. Aggregating Metrics 32. Date Functions 33. String Functions 34. CASE Statements 35. JOINs Explained 36. Window Functions 37. Sessionization Logic 38. Attribution Modeling 39. Funnel Analysis 40. Cohort Retention 41. Using CTEs 42. Creating UDFs 43. Query Optimization 44. Calculate True ROAS 45. Landing Page Report 46. SaaS CAC Case Study 47. Content Engagement 48. SQL Challenge🟣 Section 4: Looker Studio
49. Interface Tour 50. Connecting BigQuery 51. Choosing Charts 52. Date Controls & Filters 53. Calculated Fields 54. Data Blending 55. Styling Best Practices 56. Executive Dashboard 57. Marketing Performance 58. E-commerce Dashboard 59. Drill-Down & Filtering 60. Scheduled Reports 61. Sharing Permissions 62. Recreate GA4 Report 63. Agency Case Study 64. Design ChecklistMastering BigQuery, Google Marketing Platform & Looker Studio
The Layman’s Step-by-Step Playbook
By the end of this playbook, you will:
- Query terabyte-scale marketing data using SQL in BigQuery
- Connect GA4, Google Ads, and CRM data into unified datasets
- Build interactive, automated dashboards in Looker Studio
- Implement attribution models and cohort analysis from scratch
- Automate reporting pipelines and data quality checks
Prerequisites: Google Account, basic spreadsheet knowledge, curiosity about data.
Time to complete: 8-10 hours (can be done in sections)
What is BigQuery? Google’s Spreadsheet on Steroids
Imagine your Excel spreadsheet could hold billions of rows, process queries in seconds, and never crash. That’s BigQuery.
The Simple Analogy
- Excel/Google Sheets: Your kitchen table (limited space, one person works at a time)
- Database: A library (organized, but still limited)
- BigQuery: A warehouse with supercomputers (infinite space, instant retrieval, multiple teams working simultaneously)
BigQuery is a cloud data warehouse—a place to store massive amounts of data and ask questions using SQL (Structured Query Language). It’s serverless, meaning Google handles all the infrastructure. You just write queries.
Why Marketers Care
- Query raw GA4 data without sampling (unlike the GA4 interface)
- Join advertising spend with revenue data
- Build custom attribution models
- Automate reports that refresh daily
Why BigQuery for Marketers?
| Challenge | Traditional Tools | BigQuery Solution |
|---|---|---|
| Data Sampling | GA4 samples data when you apply complex segments | Access raw, unsampled hit-level data |
| Data Retention | GA4 limits historical data in standard reports | Store data indefinitely (cost-effective) |
| Cross-Platform Analysis | Export CSVs from multiple platforms, VLOOKUP hell | Join GA4 + Ads + CRM in single SQL query |
| Speed | Excel crashes at 1M rows | Query billions of rows in seconds |
| Cost | Expensive BI tools ($100s/month) | Pay-per-query, often under $10/month for small biz |
BigQuery is powerful but has a learning curve. You need to learn basic SQL. However, the marketing ROI from understanding your true customer journey is worth the investment.
Google Marketing Platform Ecosystem Map
Key Components Explained
- GA4 (Google Analytics 4): Event-based analytics, tracks user behavior
- Google Ads: Paid search, display, YouTube advertising
- CM360 (Campaign Manager 360): Ad serving and management for enterprises
- DV360 (Display & Video 360): Programmatic advertising buying
- BigQuery: Central warehouse connecting all data
- Looker Studio: Free dashboard tool (formerly Data Studio)
Looker Studio Explained: Data to Dashboard in 3 Steps
Step 1: Connect
Link your BigQuery dataset (or GA4, Sheets, Ads directly). Looker Studio fetches the schema (column names and types).
Step 2: Visualize
Drag and drop fields onto the canvas. Choose chart types: time series for trends, tables for details, scorecards for KPIs.
Step 3: Share
Add date range controls and filters. Share via link or schedule email PDFs. Your data refreshes automatically.
While Looker Studio can connect directly to GA4, using BigQuery as the middle layer allows you to:
- Clean and transform data before visualization
- Combine multiple data sources at the row level
- Implement complex calculations (LTV, CAC, ROAS) in SQL
- Reduce data source errors and inconsistencies
Setting Up Your Google Cloud Project
Before querying data, you need a “project”—a container for resources and billing.
Step-by-Step Setup
- 1Go to console.cloud.google.com and sign in with your Google account
- 2Click “Select a project” → “New Project” at the top
- 3Name your project (e.g., “marketing-analytics-2024”)
- 4Select a billing account (required even for free tier)
- 5Click “Create”
Use a descriptive project name with your company initials and date. You can have multiple projects, but data lives within a project.
Enabling BigQuery API & Setting Billing Alerts
Enable BigQuery API
- In your new project, go to “APIs & Services” → “Library”
- Search for “BigQuery API”
- Click “Enable” (takes 1-2 minutes)
Set Up Billing Alerts (Critical!)
- Go to “Billing” → “Budgets & alerts”
- Create budget: Set amount to $10 (or your comfort level)
- Set alerts at 50%, 90%, and 100% thresholds
- Add email notifications
BigQuery charges for data scanned ($5/TB). Accidentally querying a 100GB table 10 times = $5. Always use LIMIT when exploring data, and set hard billing alerts.
BigQuery has a generous free tier: 1 TB of queries/month and 10 GB storage free. Most small-to-medium businesses stay within this.
Understanding Projects, Datasets, Tables
BigQuery organizes data in a hierarchy. Think of it like a filing cabinet:
- Project: Top-level container. You query across projects if you have access.
- Dataset: Logical grouping (e.g., “ga4_data”, “ad_data”, “crm_data”). Controls access permissions.
- Table: Actual data organized in rows and columns. GA4 creates one table per day.
- View: Virtual table based on a SQL query. Doesn’t store data, just logic.
BigQuery Pricing 101: How to Stay Under $10/Month
How You’re Charged
- Storage: $0.02/GB/month (first 10GB free)
- Query Processing: $6.25/TB (first 1TB free per month)
- Streaming Inserts: $0.01/200MB (for real-time data)
Cost Control Strategies
- Always use LIMIT when exploring:
SELECT * LIMIT 100scans less data - Partition pruning: Filter on date columns:
WHERE _TABLE_SUFFIX BETWEEN '20240101' AND '20240131' - Avoid SELECT *: Select only columns you need
- Cache results: BigQuery caches identical queries for 24 hours (free)
- Preview tables: Use the UI preview button instead of querying
A typical marketing query scanning 10GB of data costs $0.0625. You could run 16,000 such queries before hitting the free 1TB limit.
Security Basics: IAM Roles for Analysts vs. Admins
Identity and Access Management (IAM) controls who can see and do what.
| Role | Permissions | Best For |
|---|---|---|
| BigQuery Data Viewer | View datasets, run queries | Marketing Analysts (read-only) |
| BigQuery Data Editor | Create tables, delete data | Data Engineers |
| BigQuery Data Owner | Full control of dataset | Project Leads |
| BigQuery Admin | Manage jobs, configurations | IT Administrators |
Granting Access
- Go to your dataset → “Share Dataset”
- Add member by email
- Select appropriate role
- Never grant “Project Owner” to analysts—principle of least privilege
Your First Query: SELECT * FROM
Open the BigQuery Console (console.cloud.google.com/bigquery). You’ll see the query editor.
The Anatomy of a Query
-- This is a comment (ignored by BigQuery)
SELECT
    column1,           -- Columns you want to see
    column2
FROM
    `project.dataset.table`  -- Three backticks required
WHERE
    condition          -- Filter rows
LIMIT
    10;                -- Safety net - never remove initially
Try This Now
SELECT
    event_name,
    event_timestamp,
    user_pseudo_id
FROM
    `bigquery-public-data.ga4_obfuscated_sample_ecommerce.events_20210131`
LIMIT
10;You queried Google’s public GA4 demo dataset. The backticks (`) are required for project names with hyphens. Always check the “Query validation” indicator (green checkmark) before running.
Quick Win: Run a GA4 Sample Dataset Query
- How to access BigQuery Console
- The structure of projects, datasets, and tables
- Basic SELECT syntax
- How to use the public GA4 sample data for practice
Challenge: Count Today’s Events
Write a query to count how many events occurred on January 31, 2021 in the sample dataset:
SELECT
    COUNT(*) as event_count
FROM
`bigquery-public-data.ga4_obfuscated_sample_ecommerce.events_20210131`;Section 2 teaches you how to connect YOUR actual GA4 data to BigQuery, not just public samples. Ready to link your own data?
Data Sources Overview: The Marketing Data Landscape
BigQuery can ingest data from virtually anywhere. Here are the most common marketing sources:
| Source | Data Type | Connection Method | Frequency |
|---|---|---|---|
| Google Analytics 4 | Events, Users | Native Linking | Streaming or Daily |
| Google Ads | Campaigns, Cost, Clicks | Data Transfer Service | Daily |
| Search Console | Search Queries, Clicks | Data Transfer Service | Daily |
| CRM (Salesforce/HubSpot) | Leads, Revenue, LTV | Fivetran/Zapier/API | Hourly/Daily |
| Google Sheets | Budgets, Targets, Categories | Direct Import | Manual/Scheduled |
| CSV Files | Historical data, Third-party | Upload/Cloud Storage | Manual |
Linking GA4 to BigQuery: Step-by-Step
This is the most important connection—enabling raw hit-level GA4 data in your warehouse.
Prerequisites
- GA4 property with Edit permission
- Google Cloud project with BigQuery API enabled
- Billing enabled (even if on free tier)
Setup Steps
- 1In GA4, go to Admin → BigQuery Links (under Product Links)
- 2Click Link → Choose your Cloud project
- 3Select data location (US or EU—choose based on your privacy requirements)
- 4Choose daily export (recommended) and/or streaming (for real-time)
- 5Click Submit
Data starts flowing from the day you link—historical data is not backfilled automatically. Link as soon as possible to start building history.
Understanding GA4 BigQuery Export Schema
Once linked, GA4 creates a dataset named analytics_XXXXXX with daily tables: events_YYYYMMDD
Key Columns Explained
- event_name: ‘page_view’, ‘purchase’, ‘click’, etc.
- event_timestamp: Microseconds since Unix epoch (UTC)
- user_pseudo_id: Anonymous device ID (cookie-based)
- user_id: Your authenticated user ID (if implemented)
- event_params: Nested array of key-value pairs (page location, value, etc.)
- user_properties: User-level attributes (membership status, etc.)
- device, geo, traffic_source: Standard dimensions
Unlike GA4’s interface, BigQuery stores event_params as a repeated record (array). You must use UNNEST() to access individual parameters. More on this next.
Flattening Nested GA4 Data: UNNEST() Explained Simply
Imagine event_params is a backpack containing multiple items. UNNEST() empties the backpack so you can see each item.
The SQL Pattern
SELECT
    event_name,
    param.key,
    param.value.string_value as string_val
FROM
    `project.analytics_XXXX.events_*`,
    UNNEST(event_params) as param
WHERE
    param.key = 'page_location'
LIMIT 10;Querying Multiple GA4 Tables with _TABLE_SUFFIX
GA4 creates one table per day. To query date ranges efficiently, use the wildcard * with _TABLE_SUFFIX.
Pattern for Date Ranges
SELECT
    event_name,
    COUNT(*) as events
FROM
    `project.analytics_XXXX.events_*`  -- Wildcard for all tables
WHERE
    _TABLE_SUFFIX BETWEEN '20240101' AND '20240131'
GROUP BY
    event_name
ORDER BY
events DESC;Using _TABLE_SUFFIX is crucial for cost control. Without it, BigQuery scans ALL historical tables (potentially TBs of data). The suffix acts as a filter, scanning only the tables in your date range.
Connecting Google Ads Data Transfer to BigQuery
To analyze cost data alongside GA4 revenue, you need Google Ads data in BigQuery.
Setup Process
- BigQuery Console → Data transfers → Create transfer
- Source: Google Ads
- Destination dataset: Create “google_ads_data”
- Link to Google Ads Customer ID (format: 123-456-7890)
- Schedule: Daily (runs at midnight PST)
What You Get
- p_Keyword: Cost, clicks, impressions by keyword
- p_Campaign: Campaign-level performance
- p_ClickStats: Click-level details
- p_StoreVisits: Offline conversions (if enabled)
Google Ads transfers cost ~$2.50 per month per customer ID. Data appears 1-2 hours after midnight.
Importing CSV/Sheets Data into BigQuery
Method 1: BigQuery UI (Small files < 10MB)
- Dataset → Create Table
- Source: Upload → Select CSV
- Destination: Create new table
- Schema: Auto-detect (review carefully!) or Edit as text
- Advanced: Check “Header rows to skip” = 1
Method 2: Google Sheets Connector (Best for budgets/lookup tables)
SELECT *
FROM
    EXTERNAL_QUERY(
        "us.sheet-connection",  -- Connection ID
        "SELECT * FROM Sheet1"
    );
Method 3: Drive URI (Direct reference)
Load data from Google Drive using the Drive URI format: gs://bucket/file.csv or Drive table references.
Using Windsor.ai/Fivetran for No-Code Data Pipelines
When native integrations don’t exist (Facebook Ads, LinkedIn, CRMs), use ETL tools.
Windsor.ai (Marketing-focused)
- Pre-built connectors for 50+ marketing platforms
- Automatic schema mapping
- Attribution modeling built-in
- Cost: ~$250/month for basic tier
Fivetran (Enterprise-grade)
- 200+ connectors including databases
- Handles schema changes automatically
- Historical sync and incremental updates
- Cost: Usage-based (rows synced)
Use these tools when you have 3+ non-Google data sources and lack SQL engineering resources. They handle API limits, retries, and normalization automatically.
Data Blending in Looker Studio vs. Pre-Joining in BigQuery
You have two ways to combine data from different sources. Each has trade-offs.
| Approach | Pros | Cons | Best For |
|---|---|---|---|
| Looker Studio Blends | No code, quick setup, visual | Slow with large data, limited join types, 5 table limit | Simple blends, small datasets (<100k rows) |
| BigQuery JOINs | Fast, complex logic, scalable, reusable | Requires SQL knowledge | Production dashboards, large datasets |
Do heavy lifting in BigQuery (JOINs, aggregations, calculations), then pipe clean results to Looker Studio. This makes dashboards load faster and ensures consistent logic across reports.
Creating Views for Reusable Data Models
Views are saved queries that act like virtual tables. They keep your logic centralized.
Example: Create a Clean Events View
CREATE OR REPLACE VIEW
    `project.dataset.clean_events`
AS
SELECT
    event_name,
    TIMESTAMP_MICROS(event_timestamp) as event_time,
    user_pseudo_id,
    (SELECT value.int_value
     FROM UNNEST(event_params)
     WHERE key = 'ga_session_id') as session_id
FROM
    `project.analytics_XXXX.events_*`
WHERE
    _TABLE_SUFFIX BETWEEN
        FORMAT_DATE('%Y%m%d', DATE_SUB(CURRENT_DATE(), INTERVAL 30 DAY))
        AND FORMAT_DATE('%Y%m%d', CURRENT_DATE());
Now your team can query clean_events without writing the complex logic every time.
Handling Time Zones & Event Timestamps Correctly
BigQuery stores GA4 timestamps in UTC microseconds. This causes confusion if not handled properly.
Conversion Pattern
-- Convert UTC microseconds to your timezone
SELECT
    event_timestamp,
    TIMESTAMP_MICROS(event_timestamp) as utc_time,
    DATETIME(
        TIMESTAMP_MICROS(event_timestamp),
        'America/New_York'
    ) as eastern_time,
    EXTRACT(HOUR FROM TIMESTAMP_MICROS(event_timestamp)) as hour_of_day
FROM
`project.analytics_XXXX.events_*`;Comparing timestamps without timezone conversion causes “future data” or “missing today” errors. Always standardize to your reporting timezone before grouping by date.
Dealing with NULLs, Type Casting, and Data Quality Checks
Handling NULL Values
-- COALESCE: Use first non-null value
SELECT
    COALESCE(user_id, user_pseudo_id) as unified_user_id,
    CASE
        WHEN user_id IS NOT NULL THEN 'Logged In'
        ELSE 'Anonymous'
    END as user_type
FROM
    `project.dataset.table`;
Data Quality Check Query
-- Daily data validation checklist
SELECT
    COUNT(*) as total_events,
    COUNT(DISTINCT user_pseudo_id) as unique_users,
    COUNTIF(event_name = 'purchase') as purchases,
    COUNTIF(event_timestamp IS NULL) as null_timestamps  -- Should be 0!
FROM
`project.analytics_XXXX.events_20240101`;Practical Example: Build a Unified Marketing Table
Combine GA4 revenue with Google Ads spend for true ROAS calculation.
WITH ga4_revenue AS (
    SELECT
        DATE(TIMESTAMP_MICROS(event_timestamp)) as date,
        traffic_source.source,
        traffic_source.medium,
        traffic_source.campaign,
        SUM(ecommerce.purchase_revenue) as revenue
    FROM `project.analytics_XXXX.events_*`
    WHERE event_name = 'purchase'
      AND _TABLE_SUFFIX BETWEEN '20240101' AND '20240131'
    GROUP BY 1, 2, 3, 4
),
ads_spend AS (
    SELECT
        DATE(segments_date) as date,
        campaign_name,
        SUM(metrics_cost_micros / 1000000) as cost  -- Convert micros to currency
    FROM `project.google_ads_data.p_Campaign`
    WHERE segments_date BETWEEN '2024-01-01' AND '2024-01-31'
    GROUP BY 1, 2
)
SELECT
    r.date,
    r.campaign,
    r.revenue,
    s.cost,
    SAFE_DIVIDE(r.revenue, s.cost) as roas
FROM ga4_revenue r
LEFT JOIN ads_spend s ON r.date = s.date
    AND REGEXP_CONTAINS(r.campaign, s.campaign_name)
ORDER BY r.date DESC;Case Study: E-commerce Brand Centralizing 5 Data Sources
The Challenge
Fashion retailer “Urban Threads” was manually combining GA4, Google Ads, Facebook Ads, Shopify, and Klaviyo data in Excel weekly (8 hours/week).
The Solution
- BigQuery Setup: Created datasets for each source
- GA4: Native daily export
- Google Ads: Data Transfer Service
- Facebook/Klaviyo: Windsor.ai connector
- Shopify: Fivetran for orders and customers
The Outcome
- Unified customer journey view: Ad click → Site visit → Purchase → Email open → Repeat purchase
- True LTV by acquisition channel identified (Email > Facebook > Google)
- Reporting time reduced from 8 hours to 15 minutes (automated)
- Found $50k/month in wasted ad spend through deduplication analysis
Troubleshooting Common Connection Errors
| Error Message | Cause | Solution |
|---|---|---|
| “Access Denied: Project XXXX” | Missing IAM permissions | Add IAM permission at project or dataset level |
| “Not found: Table XXXX” | Typo in project/dataset name or table doesn’t exist yet | Verify spelling; check if GA4 link is active (data starts flowing next day) |
| “Unrecognized name: column_name” | Column doesn’t exist in schema | Check schema tab in BigQuery UI; GA4 fields are case-sensitive |
| “Query exceeded limit” | Hit 1TB free tier or project limit | Add billing account or optimize query with _TABLE_SUFFIX |
| “Syntax error” | Missing comma, backtick, or keyword | Use query validator; check that strings use straight quotes ” |
Knowledge Check: Match the Data Source to the Connector
- How to link GA4 natively and understand its nested schema
- Setting up Google Ads Data Transfer Service
- Importing CSVs and Sheets manually
- When to use ETL tools like Fivetran vs native connectors
- Creating views for reusable data models
Quick Quiz (Try mentally!)
- I need real-time Shopify order data. Should I use a native connector or ETL tool?
Answer: ETL tool (Fivetran/Windsor) – no native connector exists - My GA4 data is missing from yesterday. What’s the likely issue?
Answer: GA4 export happens ~once daily; check if link is active - Why am I being charged $50 for one query?
Answer: Forgot _TABLE_SUFFIX and scanned 8TB of historical data
SQL Basics Refresher: SELECT, FROM, WHERE, GROUP BY
SQL is just asking questions in a structured way. Master these four clauses first.
Marketing Example: Top Traffic Sources
SELECT
    traffic_source.source,
    traffic_source.medium,
    COUNT(DISTINCT user_pseudo_id) as users,
    COUNT(*) as sessions
FROM
    `project.analytics_XXXX.events_*`
WHERE
    _TABLE_SUFFIX = '20240101'
    AND event_name = 'session_start'
GROUP BY
    traffic_source.source,
    traffic_source.medium
ORDER BY
    users DESC
LIMIT 20;Filtering GA4 Events: WHERE event_name = ‘purchase’
The WHERE clause is your filter. In GA4 data, you’ll filter by event_name most often.
Common Event Filters
-- Single event
WHERE event_name = 'purchase'

-- Multiple events (IN operator)
WHERE event_name IN ('purchase', 'begin_checkout', 'add_to_cart')

-- Exclusion
WHERE event_name != 'user_engagement'

-- Pattern matching (events starting with 'file_')
WHERE event_name LIKE 'file_%'

-- Date ranges (critical for cost control)
WHERE _TABLE_SUFFIX BETWEEN '20240101' AND '20240131'Use event_name IN (...) instead of multiple OR conditions. It’s cleaner and easier to maintain when you need to add events.
Aggregating Metrics: SUM, COUNT, AVG for KPIs
Aggregation functions collapse multiple rows into summary statistics.
Essential Aggregations for Marketing
SELECT
    DATE(TIMESTAMP_MICROS(event_timestamp)) as date,

    -- Volume metrics
    COUNT(*) as total_events,
    COUNT(DISTINCT user_pseudo_id) as unique_users,
    COUNT(DISTINCT (
        SELECT value.int_value FROM UNNEST(event_params)
        WHERE key = 'ga_session_id'
    )) as sessions,

    -- Revenue metrics (only populated for purchase events)
    SUM(ecommerce.purchase_revenue) as total_revenue,
    AVG(ecommerce.purchase_revenue) as avg_order_value,

    -- Conversion counts
    COUNTIF(event_name = 'purchase') as transactions

FROM
    `project.analytics_XXXX.events_*`
WHERE
    _TABLE_SUFFIX = '20240101'
GROUP BY
    date
ORDER BY
date;Date Functions: DATE_TRUNC, DATE_DIFF for Cohort Analysis
Time-series analysis requires manipulating dates effectively.
Key Date Functions
-- Truncate to period start (week, month, year)
DATE_TRUNC(date, WEEK)     -- Week starting Sunday
DATE_TRUNC(date, MONTH)    -- First of month

-- Difference between dates
DATE_DIFF(end_date, start_date, DAY)   -- Days between

-- Add/Subtract time
DATE_ADD(date, INTERVAL 7 DAY)
DATE_SUB(date, INTERVAL 1 MONTH)

-- Format for display
FORMAT_DATE('%Y-%m', date)  -- 2024-01
Cohort Date Calculation
-- Cohort = first day user appeared
SELECT
    user_pseudo_id,
    MIN(DATE(TIMESTAMP_MICROS(event_timestamp))) as first_seen_date,
    DATE_TRUNC(
        MIN(DATE(TIMESTAMP_MICROS(event_timestamp))),
        WEEK
    ) as acquisition_cohort
FROM `project.analytics_XXXX.events_*`
GROUP BY user_pseudo_id;String Functions: REGEXP_CONTAINS for Campaign Tagging
Clean and classify messy campaign data using regular expressions.
Common String Operations
-- Check if campaign contains 'brand' (case insensitive)
WHERE REGEXP_CONTAINS(campaign, (?i)brand)

-- Extract utm_source from page_location
REGEXP_EXTRACT(page_location, r'utm_source=([^&]+)')

-- Replace spaces with underscores
REPLACE(campaign_name, ' ', '_')

-- Upper/lower case standardization
UPPER(country)  -- USA, UK
LOWER(email)    -- for matching
Channel Grouping Logic
CASE
    WHEN REGEXP_CONTAINS(source, r'(?i)google|bing')
         AND medium = 'cpc' THEN 'Paid Search'
    WHEN REGEXP_CONTAINS(source, r'(?i)facebook|instagram|linkedin')
         THEN 'Paid Social'
    WHEN medium = 'email' THEN 'Email'
    ELSE 'Other'
END as channel_groupingCASE Statements: Creating Custom Channel Groupings
CASE is SQL’s IF/THEN logic. Essential for grouping and bucketing.
Device Category Buckets
SELECT
    CASE
        WHEN device.category = 'desktop' THEN 'Desktop'
        WHEN device.category IN ('mobile', 'tablet') THEN 'Mobile/Tablet'
        ELSE 'Unknown'
    END as device_bucket,
    COUNT(*) as events
FROM `project.analytics_XXXX.events_*`
GROUP BY device_bucket;
Revenue Tiers (LTV Segments)
CASE
    WHEN lifetime_value < 100 THEN 'Low Value'
    WHEN lifetime_value BETWEEN 100 AND 500 THEN 'Mid Value'
    WHEN lifetime_value > 500 THEN 'High Value'
    ELSE 'No Purchases'
END as customer_segmentJOINs Explained: INNER vs. LEFT JOIN with Ad Spend + Revenue
When to Use Which
- INNER JOIN: Only include dates/campaigns where you have BOTH cost and revenue data
- LEFT JOIN: Include all ad spend even if no revenue yet (common for new campaigns)
- FULL OUTER JOIN: Include all records from both sides (useful for data quality checks)
Window Functions Intro: ROW_NUMBER() for User Journey Paths
Window functions calculate across rows without collapsing them (unlike GROUP BY).
ROW_NUMBER(): Sequence Events
SELECT
    user_pseudo_id,
    event_name,
    event_timestamp,
    ROW_NUMBER() OVER (
        PARTITION BY user_pseudo_id
        ORDER BY event_timestamp
    ) as event_sequence
FROM
    `project.analytics_XXXX.events_*`
WHERE
_TABLE_SUFFIX = '20240101';For each user, assigns 1 to their first event, 2 to their second, etc. Perfect for finding “first touch” or “last touch” attribution.
LAG/LEAD: Previous/Next Event
LAG(event_name) OVER (
    PARTITION BY user_pseudo_id
    ORDER BY event_timestamp
) as previous_eventAdvanced: Sessionization Logic in GA4 Data
Recreate GA4 sessions manually to understand the logic or customize session definitions.
Standard Session Logic (30-minute timeout)
WITH events_with_time AS (
    SELECT
        user_pseudo_id,
        event_timestamp,
        TIMESTAMP_MICROS(event_timestamp) as ts,
        LAG(TIMESTAMP_MICROS(event_timestamp)) OVER (
            PARTITION BY user_pseudo_id
            ORDER BY event_timestamp
        ) as prev_ts
    FROM `project.analytics_XXXX.events_*`
    WHERE _TABLE_SUFFIX = '20240101'
),
sessionized AS (
    SELECT *,
        SUM(CASE
            WHEN prev_ts IS NULL
                 OR TIMESTAMP_DIFF(ts, prev_ts, MINUTE) > 30
            THEN 1 ELSE 0
        END) OVER (
            PARTITION BY user_pseudo_id
            ORDER BY event_timestamp
        ) as session_number
    FROM events_with_time
)
SELECT * FROM sessionized;Advanced: Attribution Modeling (Last Non-Direct Click)
Assign conversion credit to the last marketing touch before a purchase.
WITH user_touchpoints AS (
    SELECT
        user_pseudo_id,
        event_timestamp,
        event_name,
        traffic_source.source,
        traffic_source.medium,
        traffic_source.campaign,
        -- Flag if this is a conversion
        CASE WHEN event_name = 'purchase' THEN 1 ELSE 0 END as is_conversion
    FROM `project.analytics_XXXX.events_*`
    WHERE _TABLE_SUFFIX BETWEEN '20240101' AND '20240131'
),
attributed AS (
    SELECT *,
        LAST_VALUE(
            CASE WHEN source != '(direct)'
                 THEN STRUCT(source, medium, campaign)
            END IGNORE NULLS
        ) OVER (
            PARTITION BY user_pseudo_id
            ORDER BY event_timestamp
            ROWS BETWEEN UNBOUNDED PRECEDING AND CURRENT ROW
        ) as last_non_direct
    FROM user_touchpoints
)
SELECT
    last_non_direct.source,
    COUNTIF(is_conversion = 1) as attributed_conversions
FROM attributed
WHERE is_conversion = 1
GROUP BY 1
ORDER BY 2 DESC;Advanced: Funnel Analysis with Completion Rates
Calculate step-by-step drop-off in a purchase funnel.
WITH funnel AS (
    SELECT
        COUNT(DISTINCT CASE WHEN event_name = 'session_start'
            THEN user_pseudo_id END) as step1_sessions,
        COUNT(DISTINCT CASE WHEN event_name = 'view_item'
            THEN user_pseudo_id END) as step2_view_item,
        COUNT(DISTINCT CASE WHEN event_name = 'add_to_cart'
            THEN user_pseudo_id END) as step3_add_cart,
        COUNT(DISTINCT CASE WHEN event_name = 'begin_checkout'
            THEN user_pseudo_id END) as step4_checkout,
        COUNT(DISTINCT CASE WHEN event_name = 'purchase'
            THEN user_pseudo_id END) as step5_purchase
    FROM `project.analytics_XXXX.events_*`
    WHERE _TABLE_SUFFIX = '20240101'
)
SELECT
    step1_sessions,
    step2_view_item,
    ROUND(step2_view_item / step1_sessions * 100, 2) || '%' as step1_2_rate,
    step3_add_cart,
    ROUND(step3_add_cart / step2_view_item * 100, 2) || '%' as step2_3_rate,
    step5_purchase,
    ROUND(step5_purchase / step1_sessions * 100, 2) || '%' as overall_conv_rate
FROM funnel;Advanced: Cohort Retention Tables
Track how user groups (cohorts) return over time.
WITH user_activity AS (
    SELECT
        user_pseudo_id,
        DATE(TIMESTAMP_MICROS(event_timestamp)) as activity_date,
        DATE_TRUNC(
            MIN(DATE(TIMESTAMP_MICROS(event_timestamp)))
            OVER (PARTITION BY user_pseudo_id),
            WEEK
        ) as cohort_week
    FROM `project.analytics_XXXX.events_*`
    WHERE _TABLE_SUFFIX BETWEEN '20240101' AND '20240331'
),
retention AS (
    SELECT
        cohort_week,
        DATE_DIFF(activity_date, cohort_week, WEEK) as period_number,
        COUNT(DISTINCT user_pseudo_id) as active_users
    FROM user_activity
    GROUP BY 1, 2
)
SELECT * FROM retention
PIVOT (
    SUM(active_users)
    FOR period_number IN (0, 1, 2, 3, 4)
)
ORDER BY cohort_week;Using CTEs (WITH clauses) for Readable, Modular Queries
CTEs (Common Table Expressions) break complex queries into logical steps.
Structure
WITH
-- Step 1: Get raw data
raw_events AS (
    SELECT * FROM `project.dataset.table`
    WHERE _TABLE_SUFFIX = '20240101'
),

-- Step 2: Clean and transform
cleaned AS (
    SELECT
        user_pseudo_id,
        TIMESTAMP_MICROS(event_timestamp) as ts,
        event_name
    FROM raw_events
    WHERE event_name != 'user_engagement'
),

-- Step 3: Aggregate
summary AS (
    SELECT
        event_name,
        COUNT(*) as cnt
    FROM cleaned
    GROUP BY event_name
)

-- Final output
SELECT * FROM summary
ORDER BY cnt DESC;Name CTEs descriptively (e.g., purchases, ad_spend, joined_data). This makes queries self-documenting.
Creating UDFs (User-Defined Functions) for Reusable Logic
Save complex calculations as functions you can call repeatedly.
Create a Function
CREATE OR REPLACE FUNCTION
    `project.dataset.channel_grouping`(source STRING, medium STRING)
RETURNS STRING
AS (
    CASE
        WHEN source = 'google' AND medium = 'cpc' THEN 'Paid Search'
        WHEN medium = 'organic' THEN 'Organic'
        WHEN medium = 'email' THEN 'Email'
        ELSE 'Other'
    END
);
Use the Function
SELECT
    `project.dataset.channel_grouping`(
        traffic_source.source,
        traffic_source.medium
    ) as channel,
    COUNT(*) as events
FROM `project.analytics_XXXX.events_*`
GROUP BY channel;Optimizing Queries: Partitioning, Clustering, Cost-Saving Tips
Partitioning (Must-Have for GA4)
GA4 tables are automatically partitioned by date (the _TABLE_SUFFIX pseudo-column). Always filter on this.
Clustering
Organizes data within partitions by column values (e.g., event_name). Speeds up filtering.
-- When creating your own tables, add clustering
CREATE TABLE `project.dataset.clustered_table`
PARTITION BY DATE(timestamp)
CLUSTER BY event_name, country
AS SELECT * FROM source;
Cost Checklist
- ☐ Use
_TABLE_SUFFIXfor date filtering - ☐ Avoid
SELECT *– list only needed columns - ☐ Use
LIMITonly for preview, not for cost saving (full scan still happens) - ☐ Materialize intermediate results in temp tables for complex multi-step analysis
- ☐ Use
APPROX_COUNT_DISTINCTinstead ofCOUNT(DISTINCT)for large datasets (faster, less accurate but usually sufficient)
Practical Example: Calculate True ROAS by Campaign
Join Google Ads spend with Shopify revenue using campaign ID matching.
WITH campaign_revenue AS (
    -- Extract campaign from utm parameters or gclid
    SELECT
        COALESCE(
            (SELECT value.string_value FROM UNNEST(event_params)
             WHERE key = 'campaign'),
            traffic_source.campaign
        ) as campaign,
        SUM(ecommerce.purchase_revenue) as revenue,
        SUM(CASE WHEN event_name = 'purchase' THEN 1 ELSE 0 END) as transactions
    FROM `project.analytics_XXXX.events_*`
    WHERE _TABLE_SUFFIX BETWEEN '20240101' AND '20240131'
      AND traffic_source.source = 'google'
    GROUP BY campaign
),
campaign_spend AS (
    SELECT
        campaign_name,
        SUM(metrics_cost_micros / 1000000) as cost
    FROM `project.google_ads_data.p_Campaign`
    WHERE segments_date BETWEEN '2024-01-01' AND '2024-01-31'
    GROUP BY campaign_name
)
SELECT
    r.campaign,
    r.revenue,
    s.cost,
    ROUND(SAFE_DIVIDE(r.revenue, s.cost), 2) as roas,
    r.transactions,
    ROUND(SAFE_DIVIDE(s.cost, r.transactions), 2) as cpa
FROM campaign_revenue r
LEFT JOIN campaign_spend s
    ON LOWER(r.campaign) = LOWER(s.campaign_name)
WHERE s.cost > 0
ORDER BY roas DESC;Practical Example: Build a Landing Page Performance Report
SELECT
    (SELECT value.string_value
     FROM UNNEST(event_params)
     WHERE key = 'page_location') as landing_page,

    COUNT(DISTINCT user_pseudo_id) as users,
    COUNT(DISTINCT (
        SELECT value.int_value
        FROM UNNEST(event_params)
        WHERE key = 'ga_session_id'
    )) as sessions,

    -- Engagement
    AVG((
        SELECT value.int_value
        FROM UNNEST(event_params)
        WHERE key = 'engagement_time_msec'
    ) / 1000) as avg_engagement_seconds,

    -- Conversions
    COUNTIF(event_name = 'purchase') as purchases,
    SUM(ecommerce.purchase_revenue) as revenue,

    -- Calculated metrics
    ROUND(COUNTIF(event_name = 'purchase') /
        COUNT(DISTINCT user_pseudo_id) * 100, 2) as conversion_rate

FROM `project.analytics_XXXX.events_*`
WHERE _TABLE_SUFFIX = '20240101'
  AND event_name = 'page_view'
GROUP BY landing_page
HAVING users > 100  -- Filter out low-traffic pages
ORDER BY revenue DESC
LIMIT 50;Case Study: SaaS Company Improving CAC with BigQuery Cohorts
The Problem
B2B SaaS “CloudManage” had high Customer Acquisition Cost (CAC) but couldn’t identify which channels brought long-term customers vs. churners.
The Analysis
- Created cohorts by first touch attribution (Organic, Paid Search, LinkedIn)
- Joined GA4 behavior data with CRM subscription data in BigQuery
- Calculated 3-month and 12-month retention by acquisition channel
The Insight
- LinkedIn leads had 40% higher upfront CAC but 3x higher 12-month LTV
- Organic search had lowest CAC but high churn in month 2
- Paid search brought volume but neutral LTV/CAC ratio
The Action
Reallocated 30% of paid search budget to LinkedIn. Implemented onboarding email sequence for organic signups. Result: 25% improvement in blended CAC within one quarter.
Case Study: Media Publisher Analyzing Content Engagement Paths
The Challenge
News site “DailyBrief” wanted to understand which article categories led to subscription conversions.
The SQL Approach
-- Session path analysis: Category sequence before subscribe
WITH session_paths AS (
    SELECT
        user_pseudo_id,
        (SELECT value.int_value FROM UNNEST(event_params)
         WHERE key = 'ga_session_id') as session_id,
        STRING_AGG(
            CASE
                WHEN REGEXP_CONTAINS(page_location, '/politics/') THEN 'Politics'
                WHEN REGEXP_CONTAINS(page_location, '/tech/') THEN 'Tech'
                ELSE 'Other'
            END,
            ' -> ' ORDER BY event_timestamp
        ) as category_path
    FROM `project.analytics_XXXX.events_*`
    WHERE _TABLE_SUFFIX = '20240101'
    GROUP BY user_pseudo_id, session_id
)
SELECT category_path, COUNT(*) as sessions
FROM session_paths
GROUP BY category_path
ORDER BY sessions DESC;SQL Challenge: Write a Query to Find Top 10 Products by LTV
- SQL fundamentals: SELECT, WHERE, GROUP BY, JOINs
- GA4-specific patterns: UNNEST, event_params, _TABLE_SUFFIX
- Advanced analytics: Attribution, funnels, cohorts, sessionization
- Query optimization and cost control
Your Challenge
Write a query that calculates Lifetime Value (LTV) by first product purchased. Requirements:
- Find each user’s first purchase date and product
- Calculate their total revenue across all subsequent purchases
- Rank products by average LTV of customers whose first purchase was that product
Use a CTE to find first purchases with ROW_NUMBER(), another CTE to sum total revenue by user, then JOIN them and average by first product.
Looker Studio Interface Tour: Canvas, Data Pane, Properties
Looker Studio (formerly Data Studio) has four main areas:
Key Concepts
- Dimensions: Text, dates, categories (blue fields)
- Metrics: Numbers to aggregate (green fields)
- Calculated Fields: Custom formulas (orange fields)
- Controls: Filters and date ranges users can interact with
Connecting BigQuery as a Data Source
Step-by-Step Connection
- 1Create new report → BigQuery connector
- 2Authorize with Google account (must have BigQuery Viewer access)
- 3Select: Project → Dataset → Table (or paste custom SQL)
- 4Choose “Use Standard SQL” (required)
- 5Wait for field discovery (automatic type detection)
Custom SQL Option (Recommended)
Instead of connecting a raw table, paste your optimized query:
SELECT
    date,
    campaign,
    revenue,
    cost,
    revenue/cost as roas
FROM `project.dataset.marketing_summary`
WHERE date >= PARSE_DATE('%Y%m%d', @DS_START_DATE)
AND date <= PARSE_DATE('%Y%m%d', @DS_END_DATE)Use @DS_START_DATE and @DS_END_DATE to make your SQL respect Looker Studio's date range controls automatically.
Choosing the Right Chart: Scorecard vs. Time Series vs. Table
| Chart Type | Best For | Required Fields |
|---|---|---|
| Scorecard | KPIs at a glance (total revenue, users) | 1 Metric (optional: comparison date range) |
| Time Series | Trends over time (traffic, sales by day) | Date dimension + Metric(s) |
| Table | Detailed breakdowns (campaign performance) | 1+ Dimensions + Metrics |
| Pie/Donut | Part-to-whole (device category, channel mix) | 1 Dimension + 1 Metric (max 5 slices) |
| Bar Chart | Comparing categories (top campaigns) | 1 Dimension + Metric |
| Geo Map | Geographic distribution (sales by country) | Geo dimension (Country/Region/City) + Metric |
Adding Date Range Controls & Filters
Make dashboards interactive so users can explore without editing.
Date Range Control
- Insert → Date range control
- Default: Last 28 days (good for monthly reporting)
- Compare to: Previous period (shows % change on scorecards)
- Apply to: All data sources (or specific ones)
Filter Controls
- Drop-down list: Single or multi-select (Campaign, Channel)
- Search: Free text filtering (Page URL contains "/blog/")
- Slider: Numeric ranges (Revenue between $100-$500)
- Checkbox: Boolean filters (Is Mobile = True)
Each filter control adds query load. Limit to 3-4 essential filters. Use "Apply" buttons on filters to prevent constant reloading.
Creating Calculated Fields: CTR, Conversion Rate, ROAS Formulas
Build custom metrics directly in Looker Studio without changing SQL.
Formula Syntax (similar to Sheets)
CTR (Click-Through Rate):
SUM(ctr) / SUM(impressions)
or
SUM(clicks) / SUM(impressions)

Conversion Rate:
SUM(conversions) / SUM(clicks)

ROAS (Return on Ad Spend):
SUM(revenue) / SUM(cost)

AOV (Average Order Value):
SUM(revenue) / SUM(transactions)

Bounce Rate Alternative:
1 - (SUM(engaged_sessions) / SUM(sessions))
Case Statements in Calculated Fields
CASE
    WHEN SUM(cost) > 1000 THEN "High Spend"
    WHEN SUM(cost) > 100 THEN "Medium Spend"
    ELSE "Low Spend"
ENDData Blending in Looker Studio: When & How
Blend when you need to join data from different sources without SQL.
Example: Blend GA4 with Google Ads
- Add GA4 data source (left table)
- Add Google Ads data source (right table)
- Click "Blend data" → "Configure join"
- Join keys: Date + Campaign (must match format)
- Join type: Left outer (keep all GA4 data)
Blends happen in-memory and can be slow with >100k rows. For big data, pre-join in BigQuery.
Styling for Clarity: Color, Typography, White Space Best Practices
Color Guidelines
- Primary Action: Brand color for KPIs and highlights
- Positive/Negative: Green for good (up), Red for bad (down) - but consider colorblind users
- Neutrals: Grays for secondary data, borders
- Limit palette: Max 4-5 colors per report
Typography
- KPIs: Large (24pt+), bold
- Chart titles: 14-16pt, medium weight
- Axis labels: 11-12pt, light gray
- Consistency: Use max 2 font families
Layout Principles
- Most important metrics: Top-left (natural reading pattern)
- White space: 20px minimum between elements
- Alignment: Use grid snapping (View → Grid)
- Mobile: Check mobile layout (View → Mobile)
Building an Executive Summary Dashboard (5 KPIs Max)
Executives need the "So what?" immediately. Limit to 5 KPIs with context.
Recommended Executive Layout
The 5 Golden KPIs
- Revenue (or Pipeline for B2B)
- ROAS or CPA (efficiency)
- New Customer Acquisition (growth)
- Traffic Trend (leading indicator)
- Conversion Rate (health metric)
Building a Marketing Performance Dashboard
For channel managers who need tactical detail.
Required Components
- Channel Breakdown: Table with Channel, Spend, Revenue, ROAS, Conversions
- Campaign Deep-dive: Bar chart showing top 10 campaigns by ROAS
- Trend Analysis: Time series comparing Spend vs Revenue
- Device/Geo: Heatmap or treemap showing performance distribution
- Creative Performance: Table with Image/Headline + CTR + Conv Rate
Filter Set
- Date range (default: Last 30 days)
- Channel multi-select
- Campaign search box
- Device category
Building an E-commerce Dashboard
Focus on product performance and purchase funnel.
Key Sections
- Funnel Visualization:
- Add to Cart rate
- Checkout initiation
- Purchase completion
- Drop-off at each step
- Product Performance:
- Table: Product name, Views, Add to carts, Purchases, Revenue, Cart->Purchase %
- Category Analysis:
- Tree map showing revenue by category
- Customer Behavior:
- AOV (Average Order Value) trend
- New vs Returning customer split
- Time to purchase distribution
Adding Drill-Down & Cross-Filtering for Self-Service
Enable users to answer their own questions without new reports.
Drill-Down Setup
- Select chart → Setup tab
- Dimension → "Add drill-down field"
- Hierarchy: Country → Region → City
- Or: Channel → Campaign → Ad Group
Users click "Drill down" on any data point to see the next level.
Cross-Filtering (Interaction)
- Select chart → Style tab
- Enable "Apply filter" interaction
- Clicking a bar in "Channel performance" filters all other charts to that channel
Add a text box explaining: "Click any chart element to filter the entire dashboard. Use the 'Reset' button to clear filters."
Scheduled Email Reports & PDF Exports
Email Scheduling
- File → Schedule email delivery
- Set frequency: Daily, Weekly, or Monthly
- Choose format: PDF attachment or inline link
- Add recipients (can be external to organization)
- Set conditional alerts: "Only send if Revenue < target"
Export Options
- PDF: Good for presentations, static snapshots
- CSV: Raw data export from any table
- Google Sheets: Live connection (data refreshes)
Scheduled emails send data to recipients even if they don't have dashboard access. Ensure recipients are authorized to view the data.
Sharing Permissions: Viewer vs. Editor vs. Owner
| Permission | Can View | Can Edit | Can Share | Can Delete |
|---|---|---|---|---|
| Owner | ✅ | ✅ | ✅ | ✅ |
| Editor | ✅ | ✅ | ✅ | ❌ |
| Viewer | ✅ | ❌ | ❌ | ❌ |
Sharing Best Practices
- Use "Viewer" for stakeholders who just need to see results
- Use link sharing with "Anyone with the link" only for non-sensitive data
- Domain restriction: Limit to "YourCompany.com" emails only
- Data source credentials: "Owner's credentials" vs "Viewer's credentials" (latter requires each viewer to have BigQuery access)
Practical Example: Recreate a GA4 Report in Looker Studio + BigQuery
Rebuild the "Traffic Acquisition" report using your BigQuery data.
BigQuery View Setup
CREATE OR REPLACE VIEW `project.dataset.traffic_acquisition` AS
SELECT
    DATE(TIMESTAMP_MICROS(event_timestamp)) as date,
    traffic_source.source,
    traffic_source.medium,
    traffic_source.campaign,
    COUNT(DISTINCT user_pseudo_id) as users,
    COUNT(DISTINCT (SELECT value.int_value FROM UNNEST(event_params)
     WHERE key = 'ga_session_id')) as sessions,
    COUNTIF(event_name = 'purchase') as conversions,
    SUM(ecommerce.purchase_revenue) as revenue
FROM `project.analytics_XXXX.events_*`
WHERE _TABLE_SUFFIX >= FORMAT_DATE('%Y%m%d', DATE_SUB(CURRENT_DATE(), INTERVAL 90 DAY))
GROUP BY 1, 2, 3, 4;
Looker Studio Configuration
- Connect to the view above
- Table dimensions: Source, Medium, Campaign
- Metrics: Users, Sessions, Conversions, Revenue
- Calculated field: Conversion Rate = SUM(conversions)/SUM(sessions)
- Add date range control (Last 28 days default)
- Add search filter for campaign names
Case Study: Agency Scaling Client Reporting with Template Dashboards
The Problem
Marketing agency "GrowthLabs" managed 25 clients, spending 40 hours/week creating manual PowerPoint reports.
The Solution
- Created a "Master Template" in Looker Studio connected to BigQuery
- Standardized schema across clients: each client had dataset named client_XXXX with identical table structures
- Used Data Transfer Service for Google Ads (automated daily)
- Created "Make a copy" workflow for new clients
The Workflow
- Copy template report
- Update data source to client's BigQuery dataset (2 minutes)
- Customize brand colors/logo (5 minutes)
- Schedule weekly email to client (1 minute)
Result
Reporting time reduced from 40 hours to 3 hours weekly. Client satisfaction increased due to real-time data vs. monthly PowerPoints.
Dashboard Design Checklist: 10 Questions to Ask Before Publishing
- Connecting BigQuery to Looker Studio effectively
- Chart selection and calculated fields
- Interactivity: Filters, drill-downs, cross-filtering
- Sharing, scheduling, and permissions
- Design principles for different audiences
Pre-Publish Checklist
- Does the title clearly state what this dashboard shows?
- Is the date range visible and set to a logical default?
- Are numbers formatted correctly (currency, percentages, commas)?
- Does mobile layout display key metrics without scrolling?
- Are filters clearly labeled and positioned logically?
- Is there a "Last updated" timestamp visible?
- Do colors meet accessibility contrast standards?
- Are there any "broken" charts (too many categories, missing data)?
- Is sensitive data restricted to appropriate viewers?
- Have you added help text explaining custom calculated metrics?
Introduction to Dataform/dbt: Version-Controlled Transformations
When your SQL queries grow complex, manage them like software code.
What is dbt (data build tool)?
- Version-controlled SQL transformations (Git integration)
- Modular data models with dependencies
- Automated testing and documentation
- Dataform is Google's native BigQuery dbt alternative
Why Marketers Should Care
- Change history: See who modified a metric definition and when
- Environments: Develop new metrics in "dev" before pushing to "production"
- DRY principle: Define "active_user" once, reference everywhere
- Testing: Ensure revenue is always positive, user_id is never null
Consider dbt/Dataform when you have 5+ analysts, 50+ queries, and need consistent metric definitions across teams.
Automating Data Refreshes: Cloud Scheduler + Cloud Functions
Run your SQL transformations on a schedule without manual intervention.
Method 1: BigQuery Scheduled Queries (Simplest)
- Write query in BigQuery UI
- Click "Schedule" → "Create new scheduled query"
- Set frequency: Daily at 6 AM
- Destination: Append or overwrite target table
Method 2: Cloud Functions (Advanced)
For complex workflows (run query → export to Sheets → send alert):
# Python pseudocode
def refresh_marketing_data(event, context):
    from google.cloud import bigquery

    client = bigquery.Client()
    query = """
        CREATE OR REPLACE TABLE dataset.daily_summary AS
        SELECT * FROM `project.dataset.raw_events`
        WHERE DATE(timestamp) = CURRENT_DATE()
    """
    client.query(query).result()

    # Send Slack notification
    notify_slack("Marketing data refreshed!")
Deploy and trigger via Cloud Scheduler (cron job).
Using Looker Studio URL Parameters for Dynamic Filtering
Create personalized dashboard links that open pre-filtered.
Parameter Structure
https://lookerstudio.google.com/reporting/XXXXXX/page/YYYYYY?
params={"df11":"include%25E1%25SA%25E1New%20Visitors",
        "df12":"exclude%25E1SA%25E1Returning"}
Common Use Cases
- Sales territories: Link from Salesforce account record to filtered dashboard
- Client portals: One report, different data per client ID parameter
- Email campaigns: Deep link to user's specific performance data
Building Parameterized Links
Use the "Link to this report" button, check "Enable parameterization in link," then copy the modified URL.
Embedding Dashboards in Internal Tools or Client Portals
Put Looker Studio reports inside your own applications.
Embed Options
- iframe Embed:
- File → Embed report
- Copy iframe code:
<iframe src="https://lookerstudio.google.com/embed/reporting/..."> - Set width/height to 100% for responsive design
- Embed in Google Sites: Native integration, no code needed
- Embed in WordPress/Intranet: Use iframe embedder plugins
Security Considerations
- Embedded reports inherit viewer permissions
- Use "Viewer's credentials" for data sources to ensure row-level security
- Hide "View original report" link to prevent navigation away
Governance: Naming Conventions, Documentation, Access Reviews
Prevent chaos as your data warehouse grows.
Naming Conventions
Projects: company-department-env (acme-marketing-prod)
Datasets: source_purpose (ga4_raw, ads_transformed, marketing_datamart)
Tables: entity_grain (events_daily, campaigns_monthly, users_enriched)
Views: vw_purpose (vw_channel_attribution, vw_executive_summary)
Documentation Standards
- Table descriptions: Explain business purpose, not just technical content
- Field descriptions: Define calculation methodology (e.g., "LTV = Sum of all historical purchases, net of refunds")
- Lineage: Use Data Catalog to track "Table A comes from B which comes from C"
Access Review Cadence
- Monthly: Check for inactive users
- Quarterly: Review dataset-level permissions
- Annually: Full audit of who has access to PII data
Capstone Project: End-to-End Workflow
Put it all together with a complete implementation.
Scenario: E-commerce "EcoShop" Launch
- Setup (Week 1):
- Create GCP project, enable billing alerts
- Link GA4 to BigQuery
- Set up Google Ads Data Transfer
- Data Modeling (Week 2):
- Create "staging" views flattening GA4 event params
- Build "marketing_metrics" table joining GA4 + Ads data
- Schedule daily refresh at 6 AM
- Dashboard (Week 3):
- Executive summary (5 KPIs)
- Channel manager deep-dive
- Product performance tracker
- Automation (Week 4):
- Email weekly summary to stakeholders
- Create Slack alert for ROAS drops below 2.0
- Document all queries in Git repository
Next Steps: Certifications, Communities, Advanced Topics
Recommended Certifications
- Google Cloud Professional Data Engineer: For technical depth (SQL, optimization)
- Google Analytics Certification: Free, covers GA4 fundamentals
- Looker Studio Badge: Google's free skill certification
Communities to Join
- Measure Slack: analytics professionals community
- dbt Slack: For analytics engineering discussions
- r/bigquery: Reddit community for troubleshooting
- Local GA4/BigQuery Meetups: In-person networking
Advanced Topics to Explore
- Machine Learning in BigQuery (BQML) for churn prediction
- Real-time streaming analytics with Pub/Sub
- Data privacy: PII masking and row-level security
- Cost optimization: Partitioning strategies, slot reservations
Resource Appendix: Official Documentation & Courses
Official Google Resources
- BigQuery Documentation - Definitive reference
- Looker Studio Help Center - Troubleshooting guides
- Google Analytics Academy - Free courses
Specialized Learning
- GA4BigQuery.com - Schema examples, sessionization logic, attribution models
- Simmer Courses - Structured learning path, SQL basics, ecommerce queries
- CXL Institute - A/B test analysis, CRO-focused queries
- MakeItFuture - Dashboard design principles
- Windsor.ai - Cross-channel ROAS, attribution SQL
Tools & Utilities
- BigQuery Query Validator
- Looker Studio Report Previewer
- GA4 BigQuery Export Schema Cheatsheet
Quick Reference: Top 20 SQL Snippets for Marketers
1. Date filter (always use this):
WHERE _TABLE_SUFFIX BETWEEN '20240101' AND '20240131'

2. Extract event parameter:
(SELECT value.string_value FROM UNNEST(event_params) WHERE key = 'page_location')

3. Unique users:
COUNT(DISTINCT user_pseudo_id)

4. Total revenue:
SUM(ecommerce.purchase_revenue)

5. Conversion rate:
COUNTIF(event_name = 'purchase') / COUNT(DISTINCT user_pseudo_id)

6. UTC to local time:
DATETIME(TIMESTAMP_MICROS(event_timestamp), 'America/New_York')

7. Channel grouping:
CASE WHEN source = 'google' AND medium = 'cpc' THEN 'Paid Search' ELSE 'Other' END

8. Extract domain from URL:
REGEXP_EXTRACT(page_location, r'://(?:www.)?([^/]+)')

9. First touch attribution:
FIRST_VALUE(traffic_source) OVER (PARTITION BY user_pseudo_id ORDER BY event_timestamp)

10. Week-over-week comparison:
LAG(revenue) OVER (ORDER BY week) as prev_week_revenue

11. Cohort date:
DATE_TRUNC(MIN(event_date) OVER (PARTITION BY user_pseudo_id), WEEK)

12. Session duration:
MAX(event_timestamp) - MIN(event_timestamp) OVER (PARTITION BY session_id)

13. Bounce rate proxy:
COUNTIF(event_count = 1) / COUNT(DISTINCT session_id)

14. Revenue per visitor:
SUM(revenue) / COUNT(DISTINCT user_pseudo_id)

15. Top N per category:
ROW_NUMBER() OVER (PARTITION BY category ORDER BY revenue DESC)

16. Handle NULLs:
COALESCE(user_id, user_pseudo_id) as unified_id

17. Safe division:
SAFE_DIVIDE(numerator, denominator)

18. Format currency:
CONCAT('$', CAST(ROUND(revenue, 2) AS STRING))

19. Filter array:
(SELECT SUM(value.int_value) FROM UNNEST(event_params) WHERE key = 'engagement_time_msec')

20. Pivot helper:
PIVOT(SUM(users) FOR device IN ('desktop', 'mobile', 'tablet'))Troubleshooting Guide: Common Errors & Fixes
| Symptom | Diagnosis | Solution |
|---|---|---|
| "Access Denied: Project XXXX" | Missing IAM permissions | Add IAM permission at project or dataset level |
| "Not found: Table XXXX" | Typo in project/dataset name or table doesn't exist yet | Verify spelling; check if GA4 link is active (data starts flowing next day) |
| "Unrecognized name: column_name" | Column doesn't exist in schema | Check schema tab in BigQuery UI; GA4 fields are case-sensitive |
| "Query exceeded limit" | Hit 1TB free tier or project limit | Add billing account or optimize query with _TABLE_SUFFIX |
| "Syntax error" | Missing comma, backtick, or keyword | Use query validator; check that strings use straight quotes '' |
| "Unrecognized column" | Typo in column name; or column doesn't exist in that date's schema | Check schema; use * except if column is new |
| "Timezone confusion" | GA4 exports UTC; Looker Studio converts to browser time | Explicitly convert to reporting timezone in SQL |
Final Assessment: 10-Question Practical Quiz
You've completed the Mastering BigQuery & Looker Studio playbook. Test your knowledge with this practical quiz.
Practical Scenarios
- Cost Control: You need to query 2 years of GA4 data for a one-time audit. How do you prevent a $500 query charge?
Answer: Use _TABLE_SUFFIX to limit to specific months; preview first; estimate costs in UI - Data Quality: Your revenue numbers in BigQuery are 20% lower than GA4 interface. What's the likely cause?
Answer: Missing refunds; currency conversion differences; or sampling in GA4 interface - Attribution: A user clicks Facebook ad, then Google ad, then buys. Which gets credit in last-click? First-click?
Answer: Last-click = Google; First-click = Facebook - SQL Error: You get "Unrecognized name: event_params.value.string_value". What's wrong?
Answer: Need to UNNEST(event_params) first; can't access nested fields directly - Performance: Looker Studio dashboard takes 30 seconds to load. Two optimization strategies?
Answer: Pre-aggregate in BigQuery; use materialized views; enable caching; reduce date range
Ready to Implement?
Start with Section 1, Step 1: Create your Google Cloud project today.
Remember: Every data master was once a beginner. You've got this! 🚀
Python & BigQuery Integration
Connect Python applications to BigQuery using the official Google Cloud client library for programmatic data analysis.
Installation & Setup
# Install the BigQuery client library
pip install google-cloud-bigquery pandas db-dtypes

# Set authentication (service account recommended)
export GOOGLE_APPLICATION_CREDENTIALS="/path/to/service-account-key.json"
Basic Query Pattern
from google.cloud import bigquery
import pandas as pd

# Initialize client
client = bigquery.Client()

# Define query
query = """
    SELECT
        date,
        campaign,
        SUM(revenue) as revenue,
        SUM(cost) as cost
    FROM `project.dataset.campaign_metrics`
    WHERE date >= DATE_SUB(CURRENT_DATE(), INTERVAL 30 DAY)
    GROUP BY 1, 2
"""

# Execute and convert to pandas DataFrame
df = client.query(query).to_dataframe()

# Calculate ROAS in Python
df['roas'] = df['revenue'] / df['cost']
print(df.head())Use Python when you need advanced statistical analysis, machine learning (scikit-learn), or custom data transformations that are difficult in SQL.
R & BigQuery Integration
R is excellent for statistical analysis and visualization. Connect to BigQuery using the bigrquery package.
Setup in R
# Install packages
install.packages("bigrquery")
install.packages("DBI")
install.packages("dplyr")
library(bigrquery)
library(DBI)
library(dplyr)

# Authenticate (opens browser for OAuth)
bq_auth(email = "your-email@company.com")
Querying with dplyr Interface
# Create connection
con <- dbConnect(
  bigrquery::bigquery(),
  project = "your-project-id",
  dataset = "marketing_data"
)

# Query using dplyr (lazy evaluation)
campaign_data <- tbl(con, "campaign_metrics") %>%
  filter(date >= Sys.Date() - 30) %>%
  group_by(campaign) %>%
  summarise(
    total_revenue = sum(revenue, na.rm = TRUE),
    total_cost = sum(cost, na.rm = TRUE),
    roas = total_revenue / total_cost
  ) %>%
  arrange(desc(roas)) %>%
  collect()  # Execute query and pull to R

# Visualize with ggplot2
ggplot(campaign_data, aes(x = campaign, y = roas)) +
  geom_col(fill = "steelblue") +
coord_flip()Docker Overview for Analytics Workflows
Docker containerizes your analytics environment, ensuring consistency between development and production.
Why Docker for BigQuery?
- Consistency: Same Python/R versions across team members
- Portability: Run locally, on Cloud Run, or Kubernetes
- Isolation: Dependencies don't conflict with system packages
- Scalability: Easy to deploy scheduled jobs to the cloud
Basic Dockerfile Structure
FROM python:3.9-slim

WORKDIR /app

# Install dependencies
COPY requirements.txt .
RUN pip install --no-cache-dir -r requirements.txt

# Copy application code
COPY src/ ./src/
COPY config/ ./config/

# Set environment variables
ENV GOOGLE_APPLICATION_CREDENTIALS=/app/config/key.json

# Run script
CMD ["python", "src/daily_report.py"]Docker containers can deploy to Google Cloud Run (HTTP triggered), Cloud Functions (event triggered), or GKE (Kubernetes) for complex pipelines.
Querying Data Stored in Google Cloud Storage (GCS)
BigQuery can query data directly from Cloud Storage without loading it first using External Tables.
Supported Formats
- CSV: Simple, human-readable (slowest)
- JSON: Nested data structures
- Parquet: Columnar format, compressed (best performance)
- Avro: Row-based, good for streaming
- ORC: Optimized for Hive compatibility
Creating an External Table
CREATE OR REPLACE EXTERNAL TABLE `project.dataset.external_sales`
WITH CONNECTION `project.us.my_connection`
OPTIONS (
  format = 'PARQUET',
  uris = ['gs://my-bucket/sales-data/*.parquet'],
  metadata_cache_mode = 'AUTOMATIC',
  max_staleness = INTERVAL 30 MINUTE,
  require_hive_partition_filter = false
);
Querying External Data
-- Query just like a regular table
SELECT
    date,
    product_id,
    quantity,
    revenue
FROM `project.dataset.external_sales`
WHERE date >= '2024-01-01';External tables are slower than native BigQuery tables. Use for archival data or cross-cloud analytics. For frequent queries, load data into BigQuery native storage.
GMP Data in Cloud Storage: Export & Archive Strategies
Export your Google Marketing Platform data to Cloud Storage for long-term retention and cross-platform analysis.
Export Patterns
- Scheduled Exports: Use BigQuery scheduled queries to export aggregated data to GCS as Parquet files
- GA4 Export to GCS: Configure GA4 to export raw events to BigQuery, then use Cloud Functions to archive old data to GCS Coldline storage
- Backup Strategy: Keep 13 months in BigQuery (hot), archive older data to GCS Coldline (cheap)
Export Query Example
EXPORT DATA OPTIONS(
  uri='gs://archive-bucket/ga4-backup/events-*.parquet',
  format='PARQUET',
  compression='SNAPPY',
  overwrite=true
) AS
SELECT *
FROM `project.analytics_XXXX.events_*`
WHERE _TABLE_SUFFIX BETWEEN '20230101' AND '20231231';
Cost Comparison
| Storage Class | Cost per GB/Month | Best For |
|---|---|---|
| BigQuery Storage | $0.02 | Active analysis (<1 year) |
| GCS Standard | $0.020 | Frequently accessed objects |
| GCS Nearline | $0.010 | Monthly access (backups) |
| GCS Coldline | $0.004 | Quarterly access (archives) |
Python Automation: Complete Daily Reporting Script
A production-ready Python script that queries BigQuery and posts results to Slack.
import os
from google.cloud import bigquery
from slack_sdk import WebClient
from slack_sdk.errors import SlackApiError
import pandas as pd

def daily_marketing_report(event, context):
    """Cloud Function entry point"""

    # Initialize clients
    bq_client = bigquery.Client()
    slack_client = WebClient(token=os.environ['SLACK_TOKEN'])

    # Query yesterday's performance
    query = """
    SELECT
        traffic_source.source,
        COUNT(DISTINCT user_pseudo_id) as users,
        SUM(ecommerce.purchase_revenue) as revenue
    FROM `project.analytics_XXXX.events_*`
    WHERE _TABLE_SUFFIX = FORMAT_DATE('%Y%m%d', DATE_SUB(CURRENT_DATE(), INTERVAL 1 DAY))
      AND event_name = 'purchase'
    GROUP BY 1
    ORDER BY revenue DESC
    LIMIT 5
    """

    df = bq_client.query(query).to_dataframe()

    # Format message
    blocks = [{
        "type": "header",
        "text": {"type": "plain_text", "text": "📊 Yesterday's Top Channels"}
    }]

    for _, row in df.iterrows():
        blocks.append({
            "type": "section",
            "text": {
                "type": "mrkdwn",
                "text": f"*{row['source']}*: ${row['revenue']:,.2f} ({row['users']} users)"
            }
        })

    # Post to Slack
    try:
        slack_client.chat_postMessage(
            channel="#marketing-metrics",
            blocks=blocks
        )
        return f"Report sent successfully"
    except SlackApiError as e:
        print(f"Error: {e}")
raiseR Statistical Analysis: Regression & Forecasting
Use R's statistical capabilities on BigQuery data for advanced marketing analytics.
Attribution Analysis with Markov Chains
library(ChannelAttribution)
library(bigrquery)

# Pull user paths from BigQuery
paths_query <- "
  SELECT
    user_pseudo_id,
    STRING_AGG(traffic_source.source, ' > ' ORDER BY event_timestamp) as path,
    MAX(CASE WHEN event_name = 'purchase' THEN 1 ELSE 0 END) as conversion
  FROM `project.analytics_XXXX.events_*`
  WHERE _TABLE_SUFFIX >= FORMAT_DATE('%Y%m%d', DATE_SUB(CURRENT_DATE(), INTERVAL 30 DAY))
  GROUP BY user_pseudo_id
"

paths_data <- bq_project_query("your-project", paths_query) %>%
  bq_table_download()

# Run Markov Chain attribution
markov_result <- markov_model(
  paths_data,
  var_path = "path",
  var_conv = "conversion",
  var_value = NULL,
  order = 1,
  nsim = 10000,
  max_step = 10
)

# View results
print(markov_result$result)
Time Series Forecasting
library(prophet)

# Get daily revenue data
daily_revenue <- tbl(con, "marketing_metrics") %>%
  filter(date >= Sys.Date() - 365) %>%
  group_by(date) %>%
  summarise(y = sum(revenue, na.rm = TRUE)) %>%
  collect() %>%
  rename(ds = date)

# Fit Prophet model
m <- prophet(daily_revenue)
future <- make_future_dataframe(m, periods = 30)
forecast <- predict(m, future)

# Plot forecast
plot(m, forecast)Docker Deployment: Cloud Run & Cloud Functions
Deploying to Cloud Run (Container Service)
# Build container
gcloud builds submit --tag gcr.io/project-id/marketing-etl

# Deploy to Cloud Run
gcloud run deploy marketing-etl
  --image gcr.io/project-id/marketing-etl
  --platform managed
  --region us-central1
  --set-env-vars="PROJECT_ID=project-id"
  --service-account=etl-service-account@project-id.iam.gserviceaccount.com
Cloud Build Configuration (cloudbuild.yaml)
steps:
  # Build the container
  - name: 'gcr.io/cloud-builders/docker'
    args: ['build', '-t', 'gcr.io/$PROJECT_ID/marketing-etl:$SHORT_SHA', '.']

  # Push to registry
  - name: 'gcr.io/cloud-builders/docker'
    args: ['push', 'gcr.io/$PROJECT_ID/marketing-etl:$SHORT_SHA']

  # Deploy to Cloud Run
  - name: 'gcr.io/cloud-builders/gcloud'
    args:
      - 'run'
      - 'deploy'
      - 'marketing-etl'
      - '--image=gcr.io/$PROJECT_ID/marketing-etl:$SHORT_SHA'
      - '--region=us-central1'
      - '--platform=managed'
      - '--allow-unauthenticated'
Scheduling with Cloud Scheduler
gcloud scheduler jobs create http daily-etl-job
  --schedule="0 6 * * *"
  --uri="https://[CLOUD_RUN_URL]"
  --http-method=GET
--time-zone="America/New_York"Advanced Storage Integration: Federated Queries
Query external data sources directly from BigQuery without importing.
Querying Cloud SQL (PostgreSQL/MySQL)
SELECT *
FROM EXTERNAL_QUERY(
    'project.us.connection_id',
    'SELECT user_id, email, subscription_tier FROM users WHERE active = true'
);
BigQuery Omni (Multi-Cloud)
Query data in AWS S3 or Azure Blob Storage from BigQuery:
CREATE EXTERNAL DATASET `project.aws_dataset`
WITH CONNECTION `project.aws.us-east-1`
OPTIONS (default_storage_location = 's3://bucket/path/');

-- Query S3 data directly
SELECT * FROM `project.aws_dataset.sales_data`
WHERE year = 2024;
Cloud Bigtable (NoSQL) Integration
-- Query real-time user activity from Bigtable
SELECT
    rowkey,
    CAST(cell.value AS STRING) as event_json
FROM `project.dataset.bigtable_external`
WHERE rowkey LIKE 'user_123%';Federated queries are ideal for joining BigQuery analytics with operational databases (CRM status, inventory levels) without ETL delays.
BigQuery ML: Machine Learning in SQL
Build and deploy machine learning models directly in BigQuery using standard SQL syntax.
Creating a Churn Prediction Model
-- Create model to predict which users will churn
CREATE OR REPLACE MODEL `project.dataset.churn_model`
OPTIONS(
    MODEL_TYPE = 'LOGISTIC_REG',
    INPUT_LABEL_COLS = ['churned'],
    AUTO_CLASS_WEIGHTS = TRUE,
    DATA_SPLIT_METHOD = 'AUTO_SPLIT'
) AS
SELECT
    user_pseudo_id,
    days_since_last_visit,
    total_sessions,
    avg_session_duration,
    total_revenue_30d,
    CASE WHEN days_since_last_visit > 30 THEN 1 ELSE 0 END as churned
FROM `project.dataset.user_features`
WHERE date < CURRENT_DATE() - 30;  -- Train on historical data
Making Predictions
-- Score current users
SELECT
    user_pseudo_id,
    predicted_churned,
    probability[OFFSET(1)].prob as churn_probability
FROM ML.PREDICT(
    MODEL `project.dataset.churn_model`,
    (SELECT * FROM `project.dataset.current_user_features`)
)
WHERE probability[OFFSET(1)].prob > 0.7
ORDER BY churn_probability DESC
LIMIT 100;- Python & R integration patterns
- Docker containerization for analytics
- Cloud Storage integration and archival
- Deployment strategies for Cloud Run
- Machine Learning with BigQuery ML
Leave a Reply
You must be logged in to post a comment.